Competition
What's covered?
This guide covers the Competition view within the Reviews section of Moz Local.
Getting started with Competition
The Competition view of Moz Local is located within the Reviews section of the left-hand navigation menu.
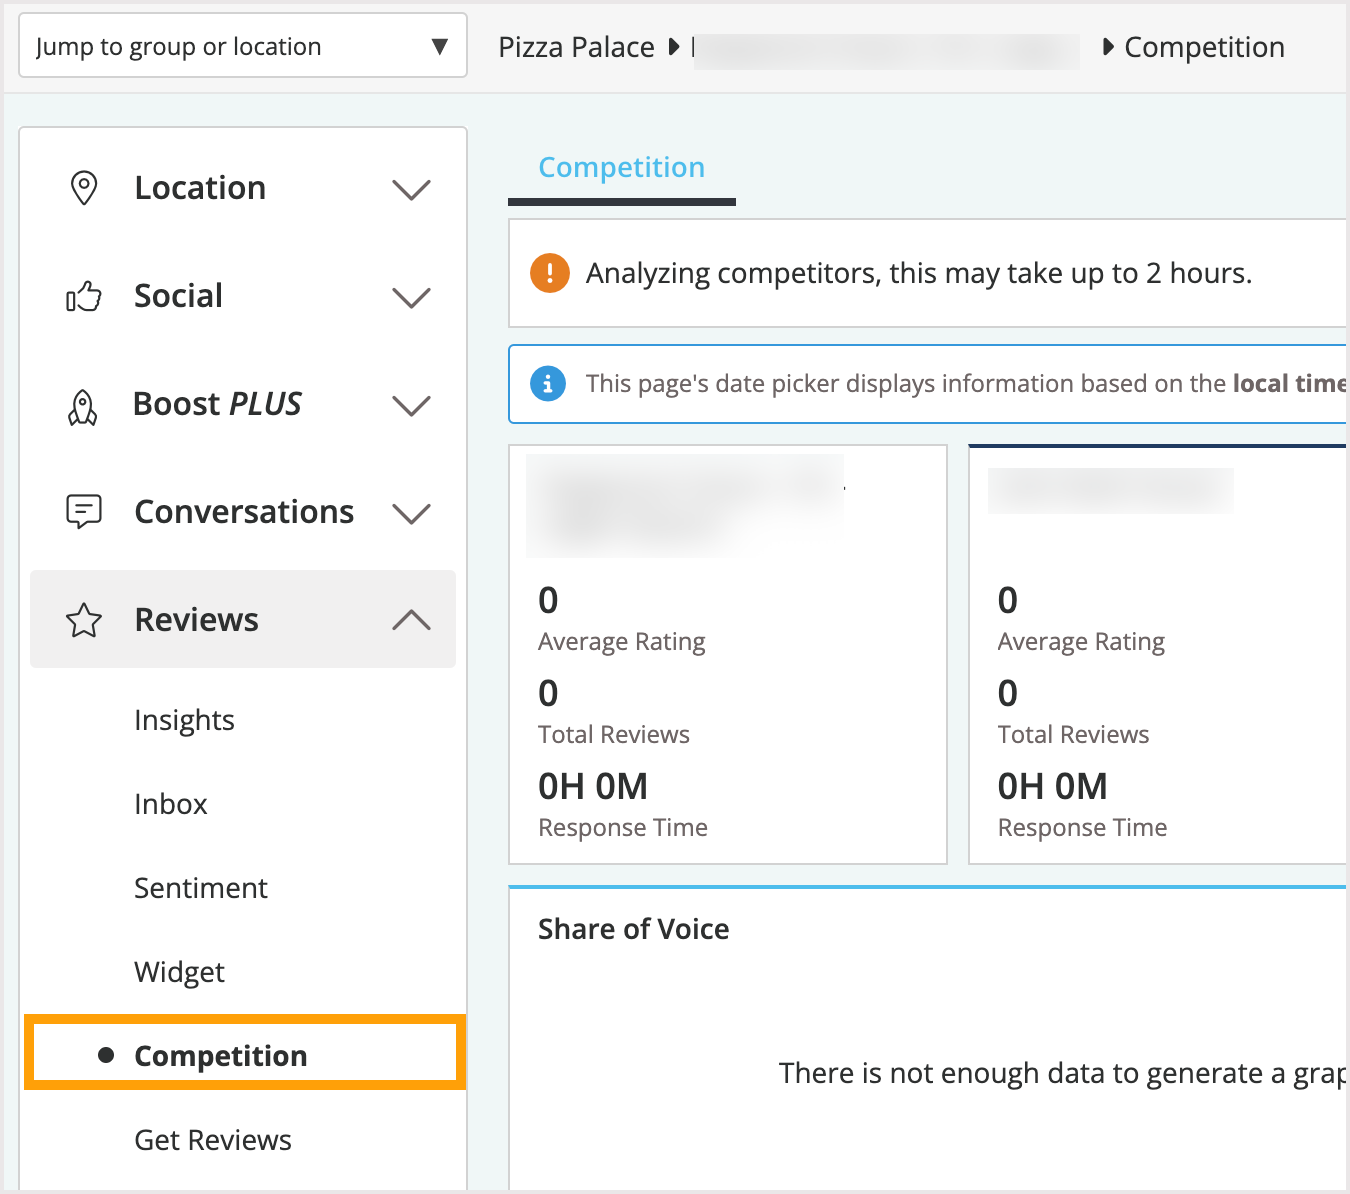
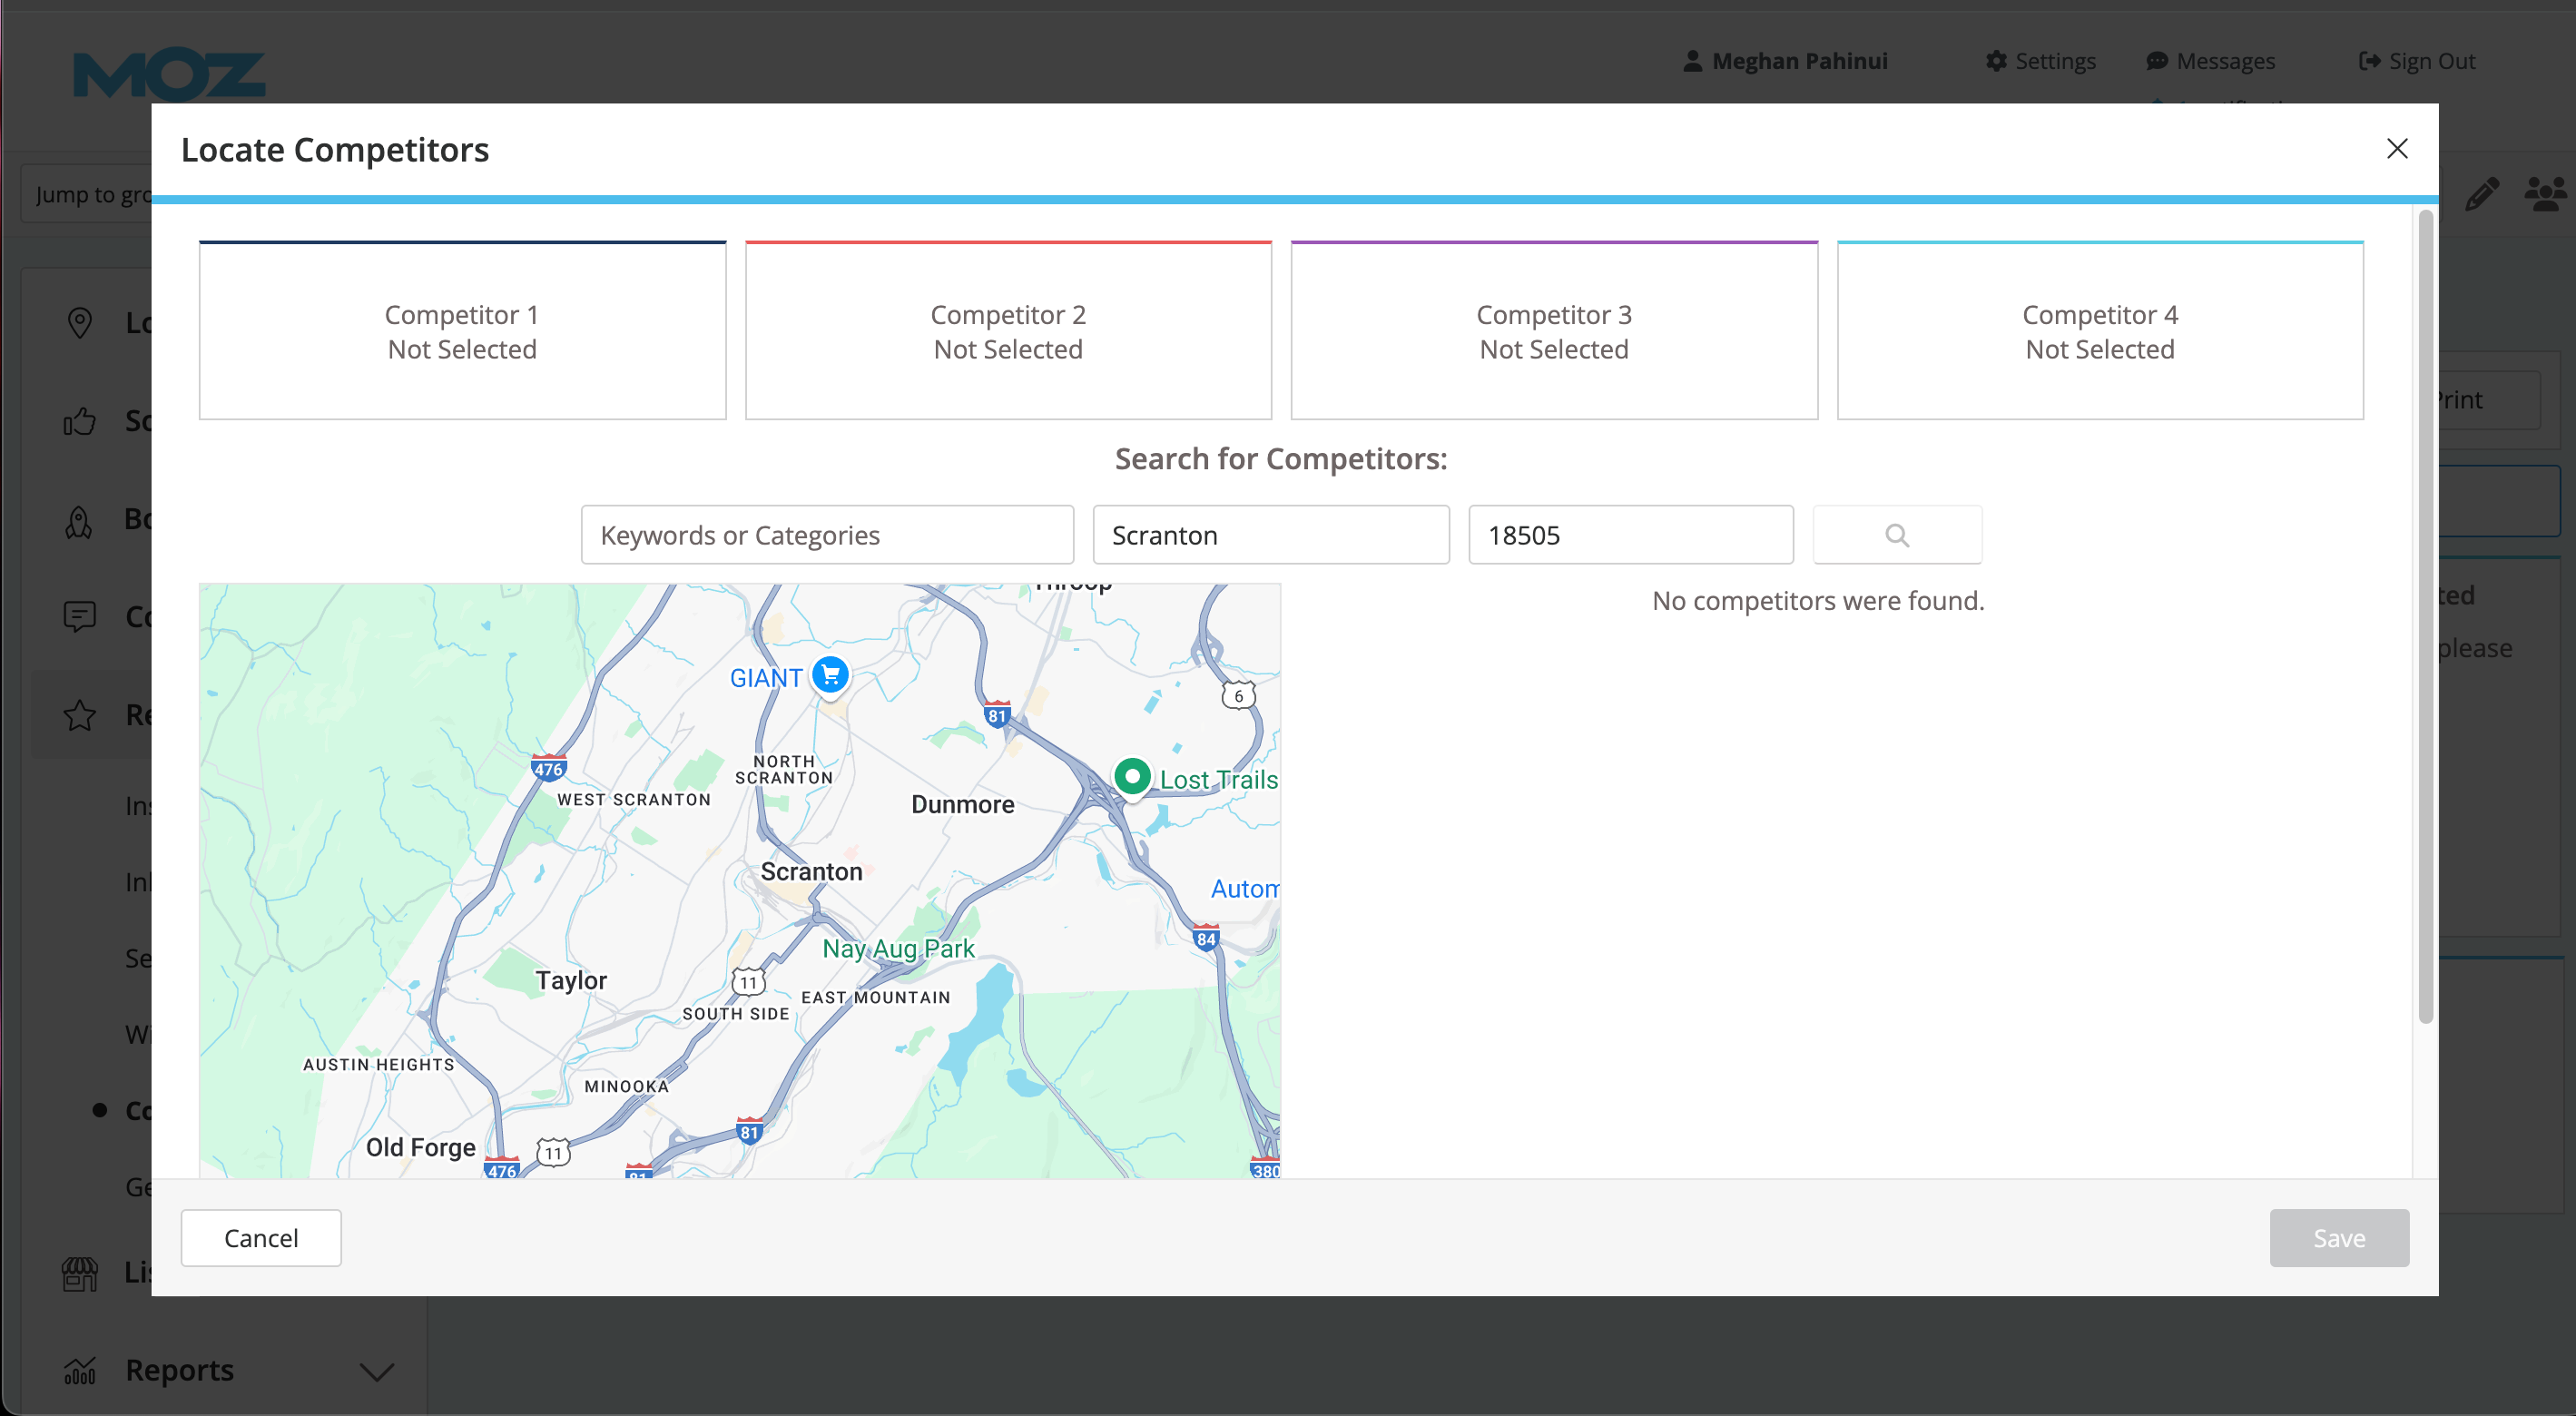
In order to see data within the Competition dashboard of Moz Local, you will first need to select competitors to track. You’ll be prompted to select your competitors when you visit this section of the tool for the first time.
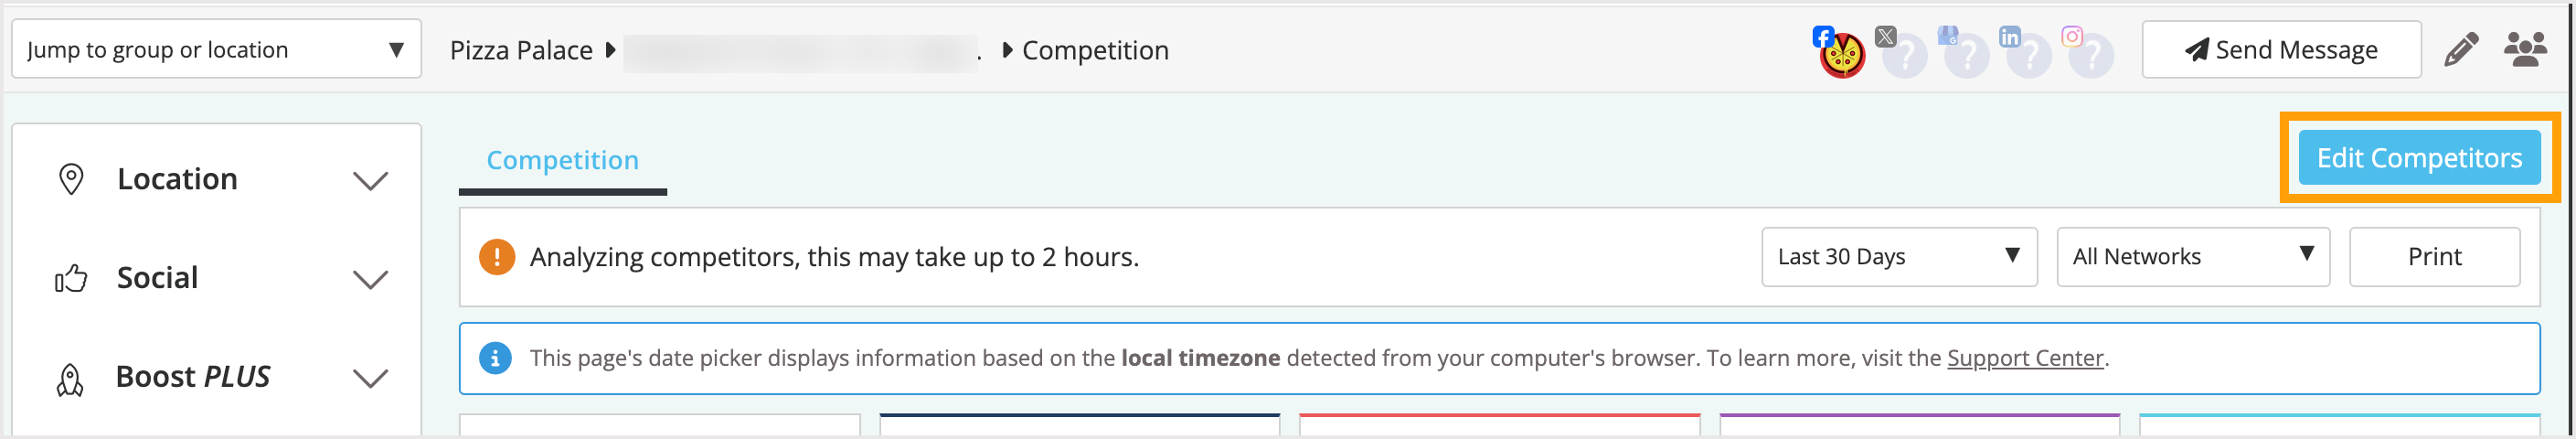
If you find that you are not tracking the right competitors or want to update your competition, you can do so at any time using the Edit competitors button on the top right.
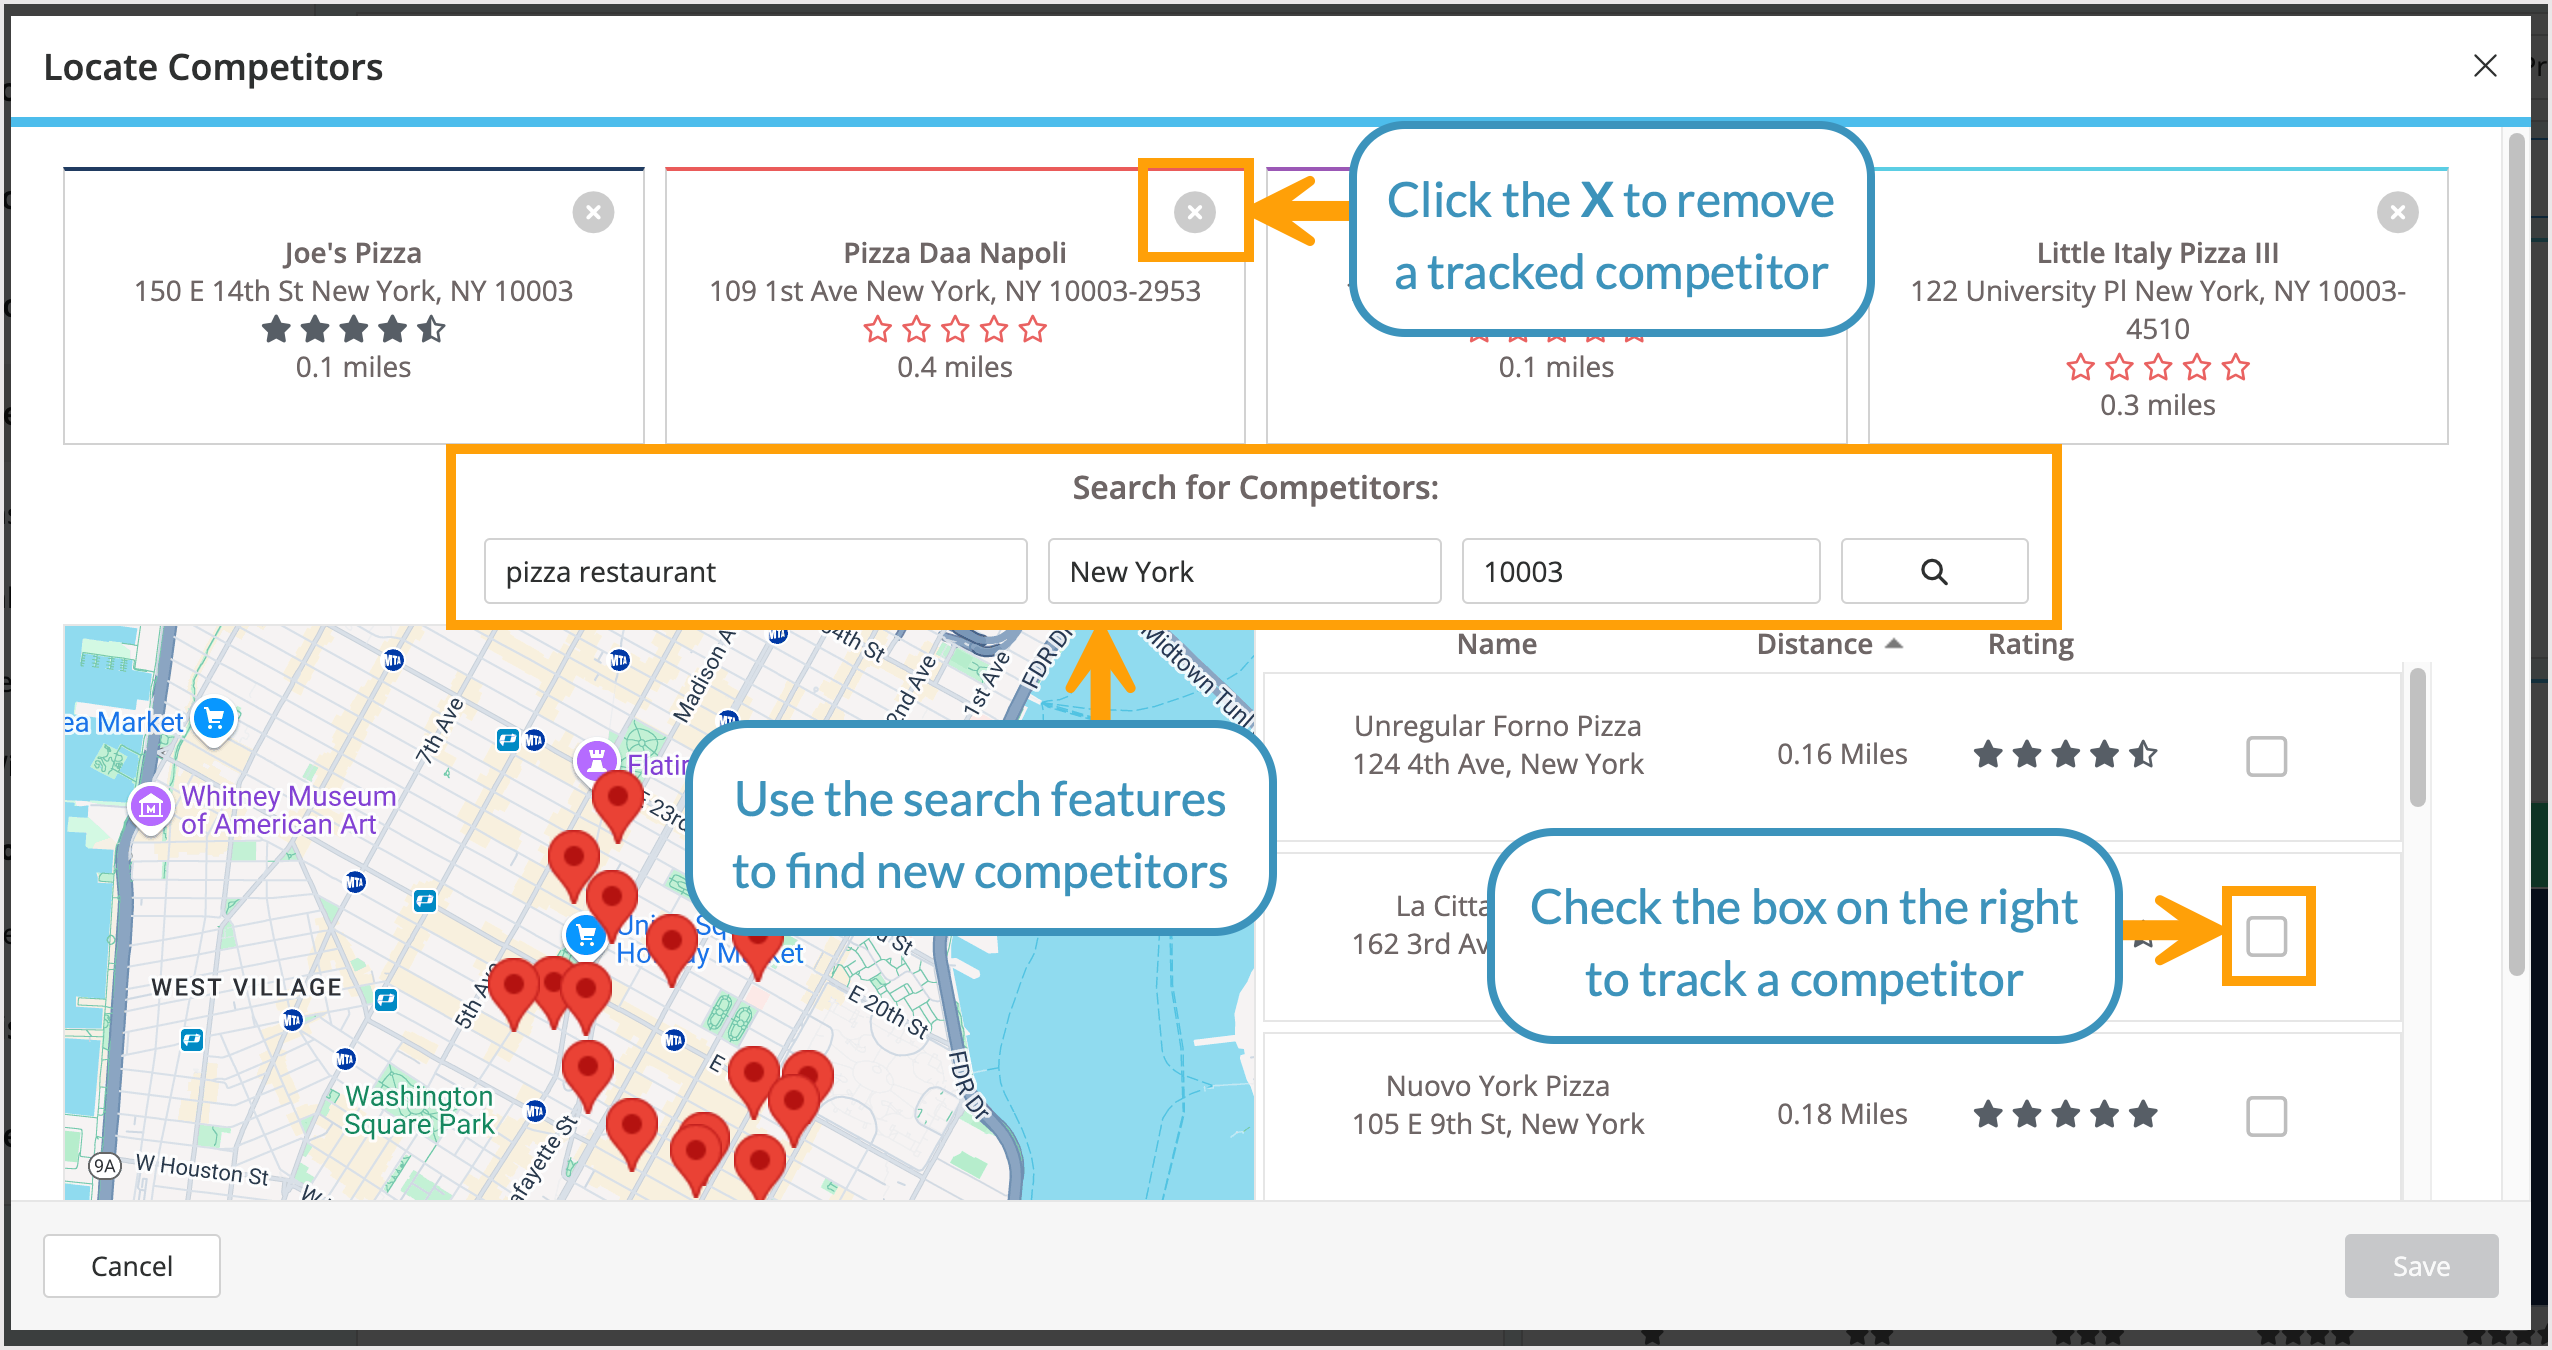
From within the pop-up, click the X beside any competitor you’re currently tracking to remove it. Then use the search bar to find and select new competitors to track.
Competitor Data — Overview
Once you’ve selected competitors to track and the data has finished populating, you will see a set of overview modules at the top of the page.
The drop-down menus at the top of the page allow you to segment the data by timeframe and network. The data gathered from competitors will go as far back as their reputation data is available.
The first block in the overview section (to the left) shows you the review data for your location. This allows you to easily compare your review data to your competitors' side by side.
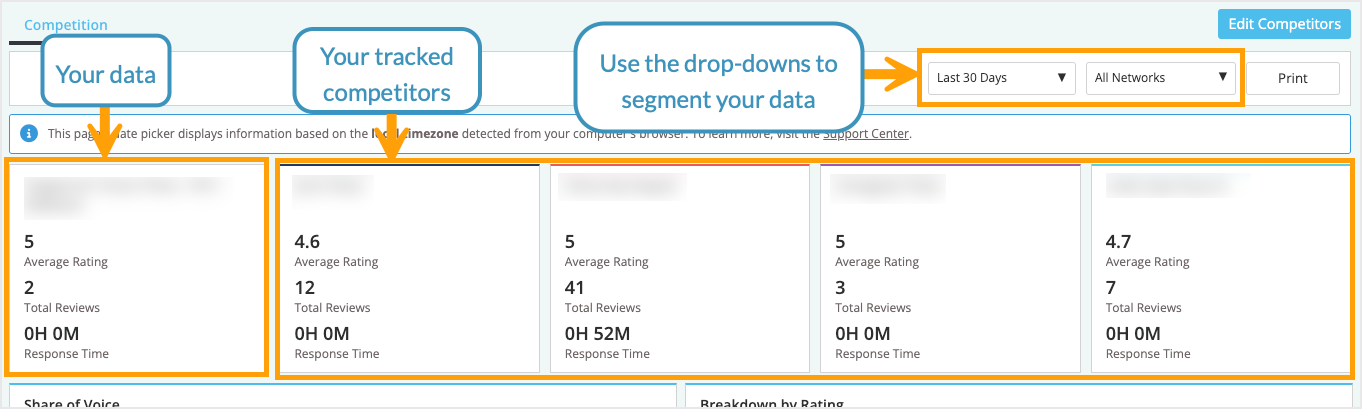
Each overview block will include:
- Business name (either your business or your competitor’s business name)
- Average rating for the location
- Total number of reviews
- Average response time
If a business has not responded to reviews, the Response Time will be 0H 0M.
Share of Voice pie chart
Below the review data overview for you and your competitors is the Share of Voice pie chart. This chart breaks down how often your top keywords are being used in your reviews, compared to how often those same keywords are being used in the reviews of your selected competitors.
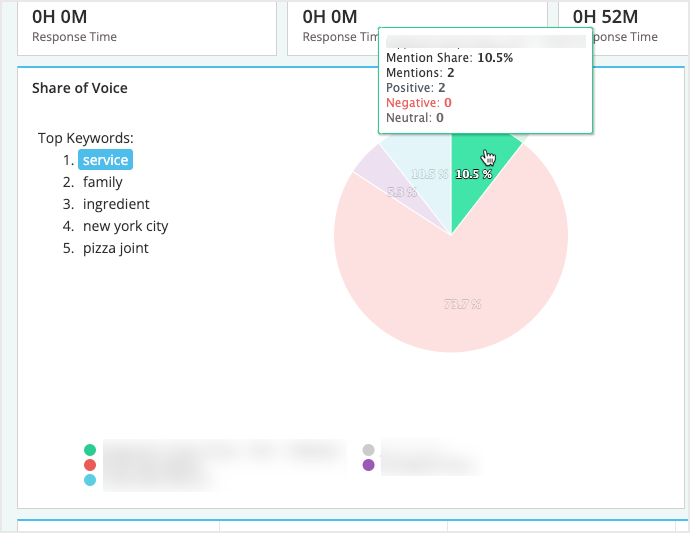
Hovering over a segment of the pie chart displays the overall mentions and the sentiment for that particular keyword. To filter through your keywords, click the word to the left of the diagram.
Breakdown by Rating chart
Next to the Share of Voice pie chart is the Breakdown by Rating chart. This stacked bar chart breaks down the number of star ratings you have received against your competition.
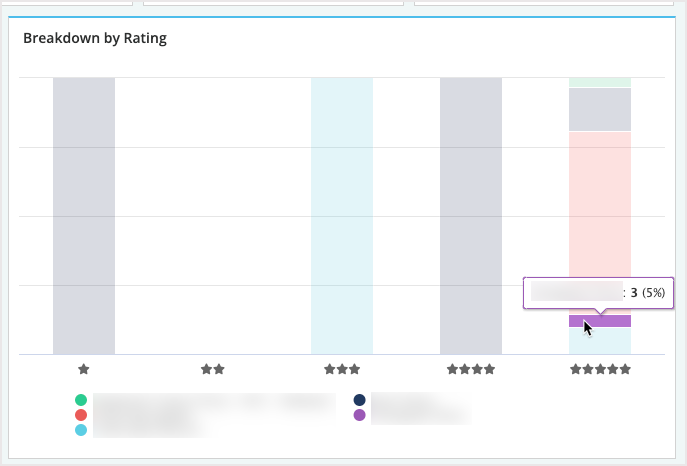
You have the ability to hover over each bar in order to see the quantity and percentage of each star rating you have received in comparison to the other businesses you have selected.
Network Breakdown table
Below the Breakdown by Rating and Share of Voice charts, a table will highlight and compare the number of reviews you have and your review site’s overall rating to those of your competitors. Keep in mind that only the networks you have synced for your business will be displayed and taken into account for this comparison against your local competition.

Response Time vs. Competitors chart
As you continue to scroll down the Competition dashboard, you will see a chart comparing your response time to the response time of your competitors.
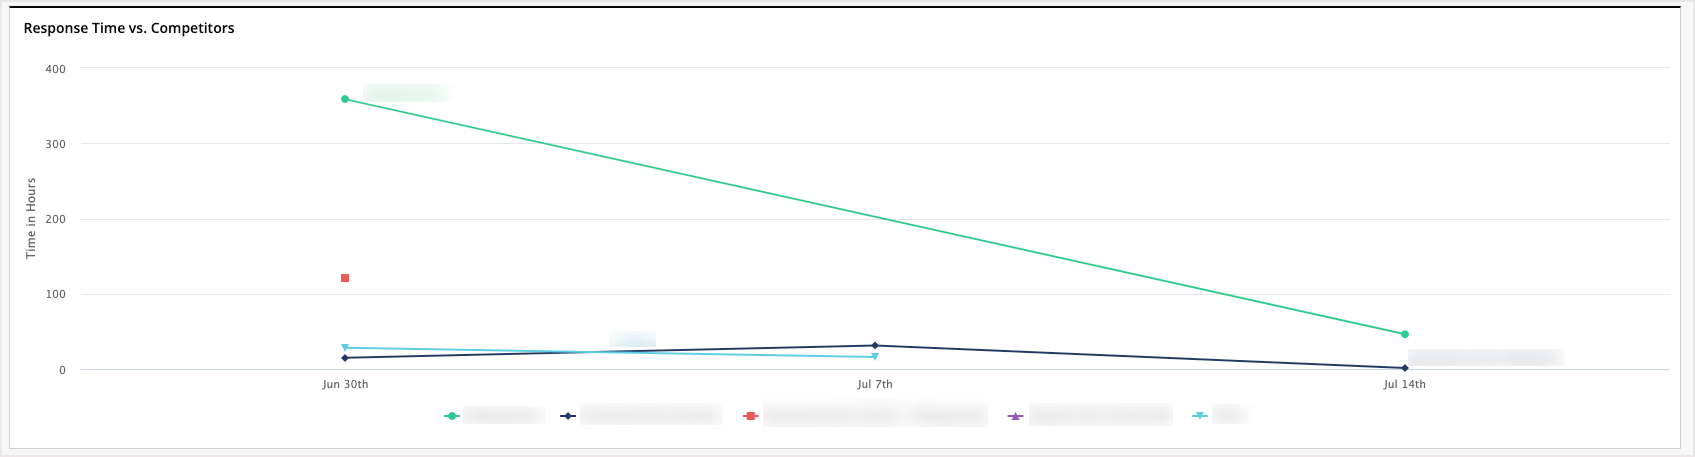
You can hover over any data point in the graph to see additional information. Or remove competitors from the graph by clicking them below the graph.
Reviews Over Time vs. Competitors chart
Finally, you will see a chart comparing the number of reviews you’ve received over time to that of your competitors.
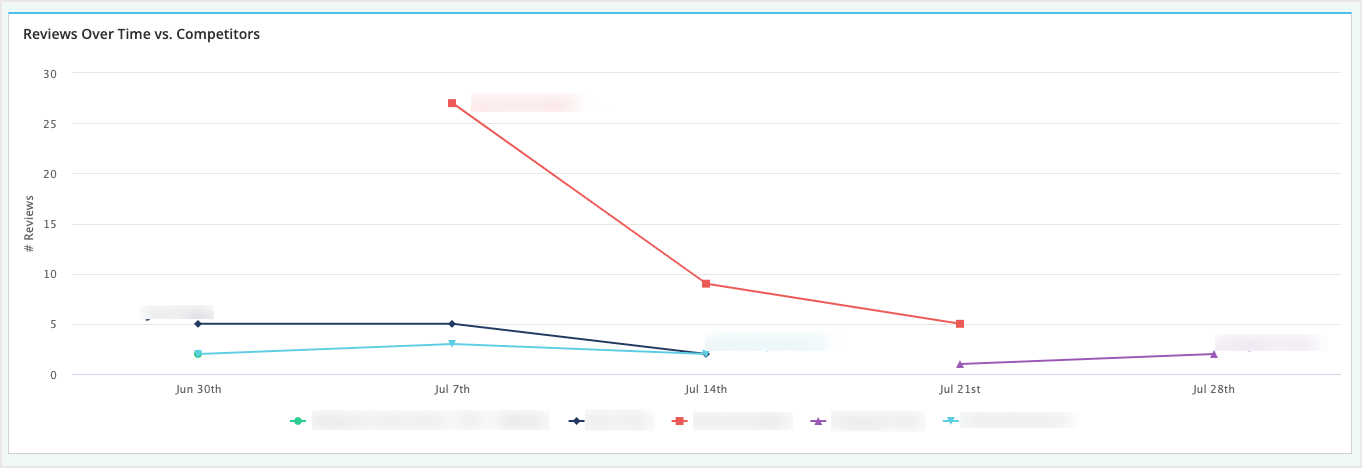
You can hover over any data point in the graph to see additional information. Or remove competitors from the graph by clicking them below the graph.
Was this article helpful?
![]() Yes! Amazing!
Yes! Amazing!
![]() Yes! It was what I needed.
Yes! It was what I needed.
![]() Meh. It wasn’t really what I was looking for.
Meh. It wasn’t really what I was looking for.
![]() No, it wasn’t helpful at all.
No, it wasn’t helpful at all.
Thanks for the feedback.